
Charts
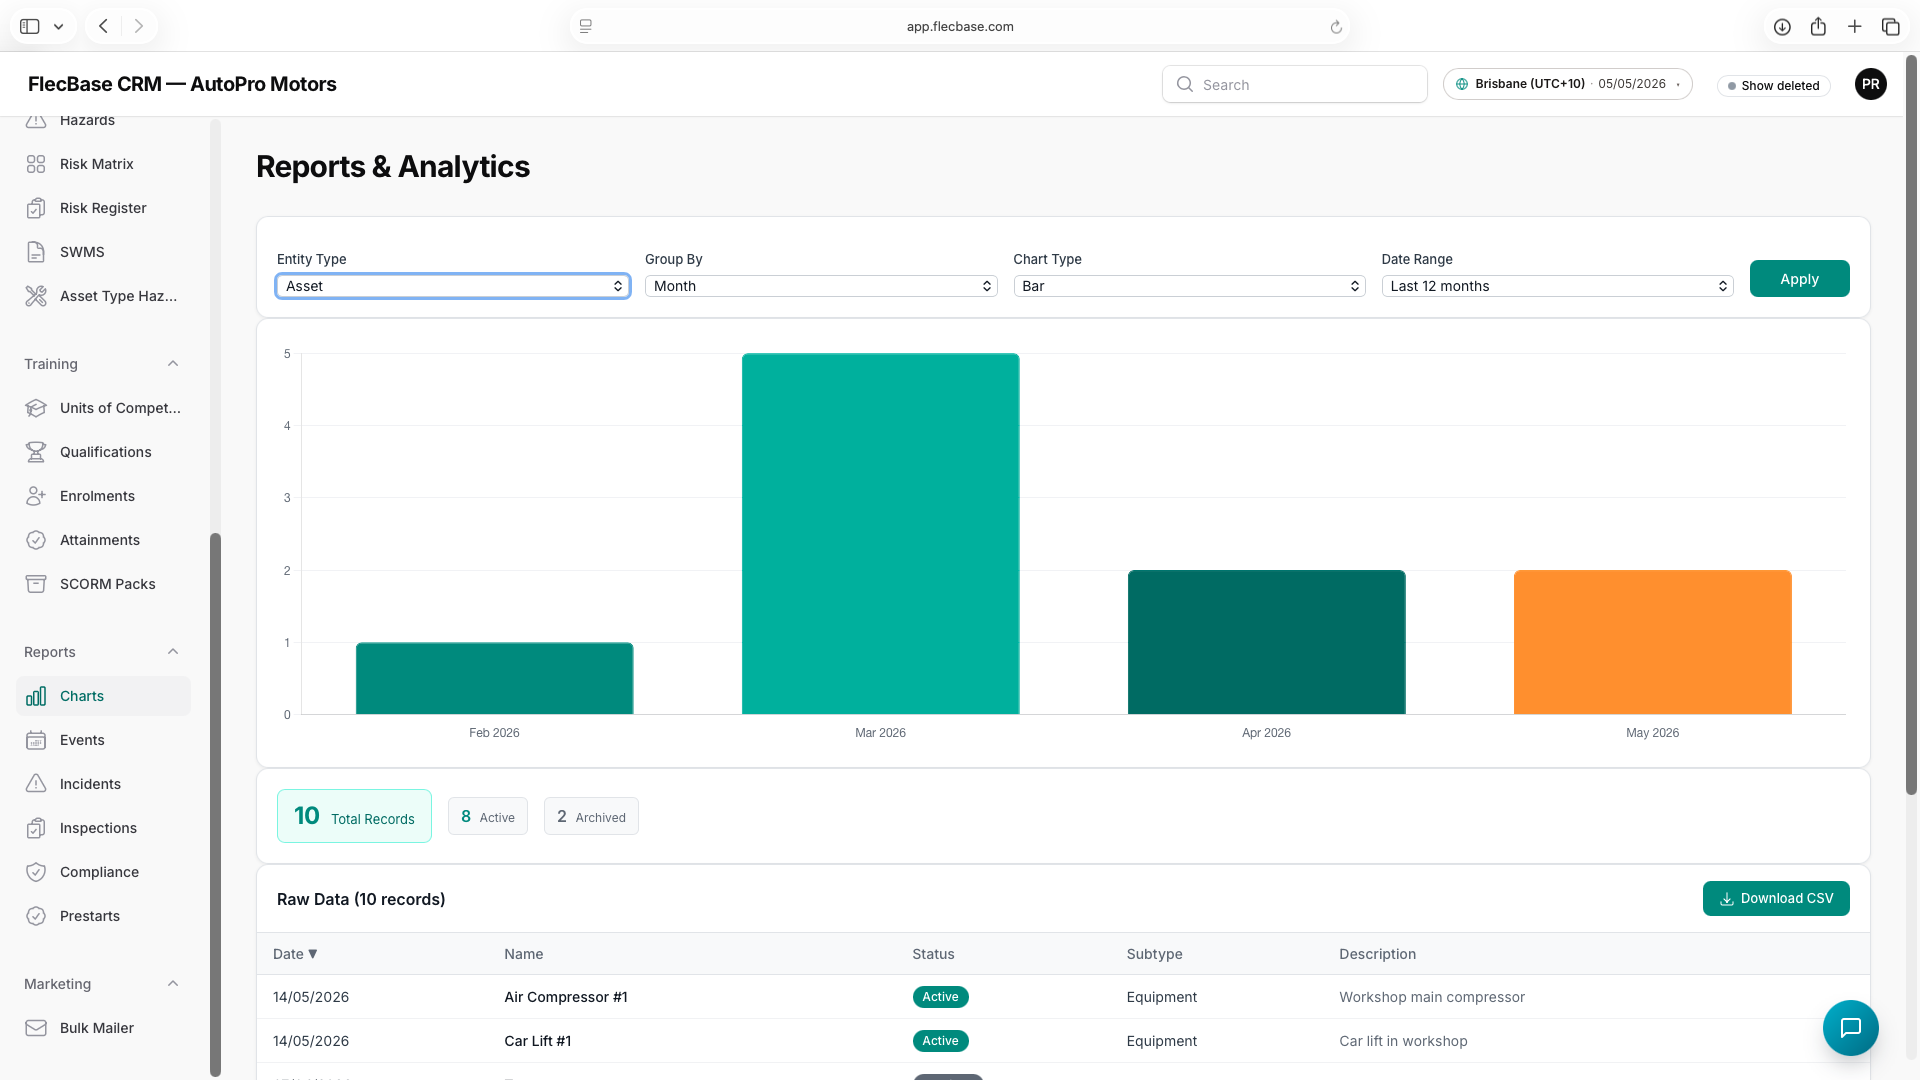
Charts turn your data into at-a-glance visuals — compliance status, placements and activity.
Use charts to spot gaps and trends across your workspace, and to filter down to a project, site or date range when you need detail.
charts_1.pngCharts turn your data into at-a-glance visuals — compliance status, placements and activity.
Use charts to spot gaps and trends across your workspace, and to filter down to a project, site or date range when you need detail.
charts_1.png